

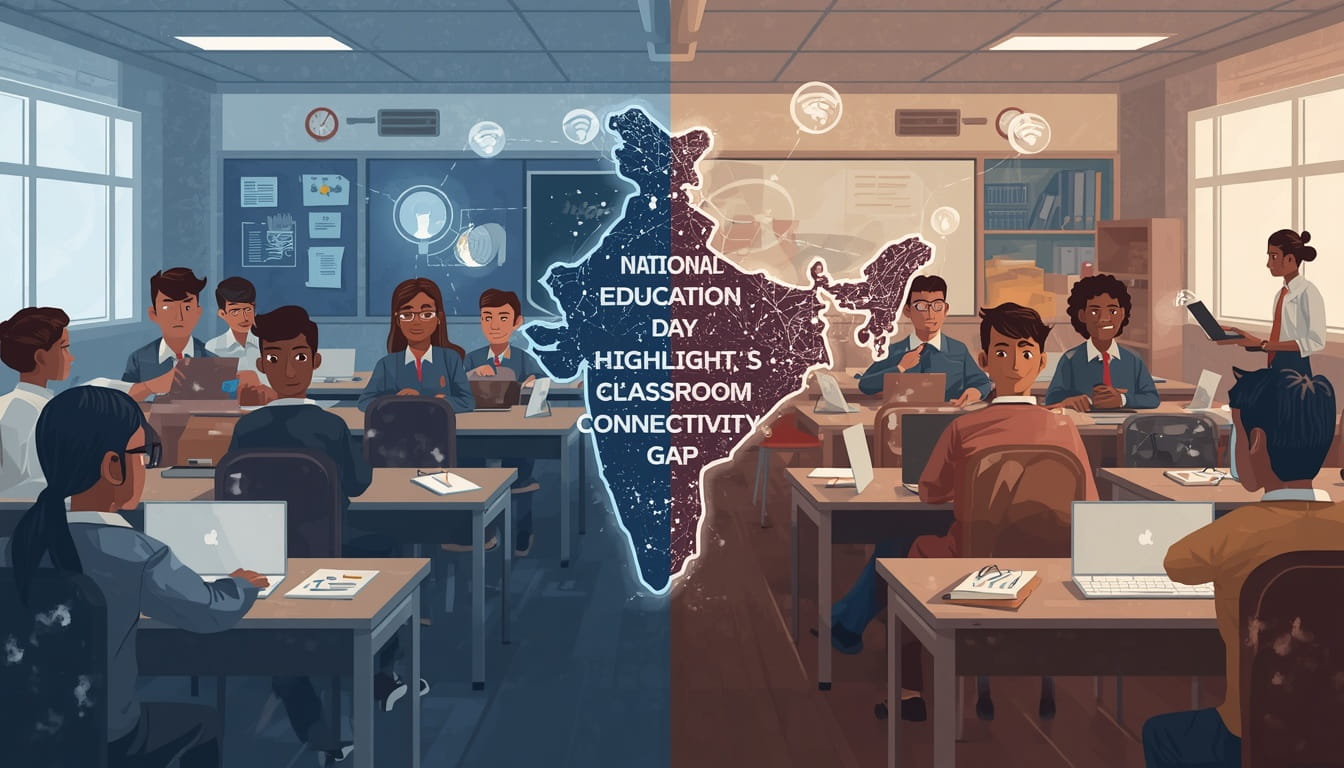

On November 11th, India celebrated its National Education Day and at the same time, was faced with a continuing issue regarding schools throughout the country: How do we make digital learning part of our everyday classroom experience when we have so many schools without internet access? According to UDISE+ 2025–26, there are 67.4% of schools that have some form of internet connection, and 69.9% of schools that have computers. Although these statistics represent progress, they also indicate that a significant number of schools do not currently possess the basic requirements for a digital learning environment.
The Ministry of Education’s school database includes 14.67 lakh schools, 1.03 crore teachers and 24.72 crore students; as per the government summary of the report. Although these numbers give an overall picture of infrastructure, student population and staff, they do not show how frequently students can access a connected computer nor do they indicate how effectively technology is being utilized during teaching. National Education Day is celebrated each year on the birth anniversary of Maulana Abul Kalam Azad, the first Education Minister of Independent India.
Progress is measurable, but uneven
The Ministry’s report states that the percentage of computers available in schools has increased from 64.7 percent in the school year 2024-25 to 69.9 percent in the school year 2025-26. Also, the percentage of schools with internet connectivity has risen from 63.5 percent to 67.4 percent. At a national level, these increases are substantial. However, the most recent data indicates that about one third of all schools reporting were unable to confirm whether they had access to the internet. This lack of access could potentially limit students’ ability to utilize online resources for learning purposes, as well as limiting teachers’ ability to utilize digital tools for instruction and administrative functions.
In addition to the aforementioned data, the government report reports significant progress on basic services available to students; such as 95% of all schools having access to electrical service, 99.5% having access to safe drinking water, 98.5% having access to girls’ toilets, and 90.5% having access to libraries. Additionally, ramps with handrails were recorded at 58.2% of schools. The aforementioned indicators illustrate that school readiness encompasses many elements beyond simply providing students with technology devices. For example, student connectivity is dependent upon the availability of electrical services, physical accessibility, maintenance of equipment, and trained personnel, whereas the learning process is dependent upon teacher quality, appropriate instructional materials for the language used by students, and consistent attendance.
The Press Information Bureau’s article on UDISE+ 2025–26 provides the official numbers and demonstrates the progress being made. While independent comparisons provide additional insight into the overall improvement, the data is collected via the government’s school information system. Readers must view the data provided as administrative reporting, not as direct measurements of student performance within the classroom.
A connection is not the same as access
The availability of internet service does not guarantee its quality; it may be intermittent, too slow for use by multiple classrooms, or unavailable to students during large portions of each day. A computer listed on a school’s inventory may be shared among numerous students or require repair. On the other hand, a school with no fixed broadband access can utilize offline resources effectively. National data on internet service do not reflect these differences without additional information regarding the reliability of service, the frequency of service, and access to service by grade level.
This means the policy challenge is shifting from installation to use. Schools will require reliable power, technical assistance, replacement programs for devices and professional development to assist teachers in incorporating technology into their lessons. Additionally, students will need protections for privacy and access to appropriate content based on their age. If schools introduce technology prior to establishing these fundamentals, technology may serve as a simple demonstration on occasion, instead of being a regular learning tool.
What the data can—and cannot—say
The UDISE+ database is a valuable resource that can help with both national planning and school comparisons. It includes data on school facilities, student numbers and staff, which the Ministry says helps make decisions based on evidence. That being said, the infrastructure statistics included within the UDISE+ should not be seen as a reliable indicator of what children will learn in a school. Just because a school is connected doesn’t mean its students are learning more; similarly, just because a school has less connectivity than others doesn’t mean it doesn’t offer excellent teaching via books, teachers, and resources available locally.
The data should also be presented by state, rural/urban setting, type of school management, and student requirements. National progress does not mean there are no significant shortages in specific locations. For instance, accessibility data shows that ramps with handrails are fewer in number than many other simple forms of facility provision. For a student with a mobility impairment, this lack of access may be far more detrimental to their educational experience than the existence or non-existence of a computer lab at the school.
The next stage is dependable, useful infrastructure
National Education Day is an occasion to emphasize the daily conditions that create real learning from formal access. Examples include: having a functional internet connection at each school, giving teachers support, making instructional materials available in the language of the community, and developing instructional resources for students with physical or developmental limitations. In addition to these examples, schools require a means of reporting when promised equipment does not function.
Public dashboards and future releases of UDISE+ can measure if the digital divide is narrowing and access is becoming more fair. Equity can be measured in terms of reliability, student access, and how the technology impacts teaching, rather than merely measuring the number of campuses that have internet or computers. This broader perspective will allow policy makers to determine where the next investment is best suited.
Digital Education in India: An Unfinished Journey with Real Progress India’s Digital Education Journey is One of Actual Growth with Much Left to Be Done. While New Data Shows a Definite Increase in School Infrastructure, it Marks the Huge Amount of Work Still Needed to Complete the Mission. A Computer and a Network Connection Can Open Doors for Students, however Only if These Tools Exist Within Schools, are Maintained Properly and are Connected with Qualified Teachers. To Achieve This Goal we Do Not Just Want to Put Technology Into Schools; We Want to Create Better Learning Opportunities for All of Our Students Who Require Them.